How We Crushed Our Client’s Sales With Databox
We juggle a lot as an inbound marketing agency. Each client has a different product or service which requires a different strategy to achieve their goals. While some agencies struggle working with a variety of clients, we thrive! I’m not saying we don’t want to pull our hair out sometimes but we love the challenge!
Technology has made staying on top of client tasks and goals much simpler. You hear us rave about Hubspot all the time and I’m not going to say they’re my number one choice in managing marketing goals, tasks, and automation but…(they’re definitely #1).
![]() Another tool we started using this year is Databox and they quickly moved into our top 5.
Another tool we started using this year is Databox and they quickly moved into our top 5.
What Is Databox?
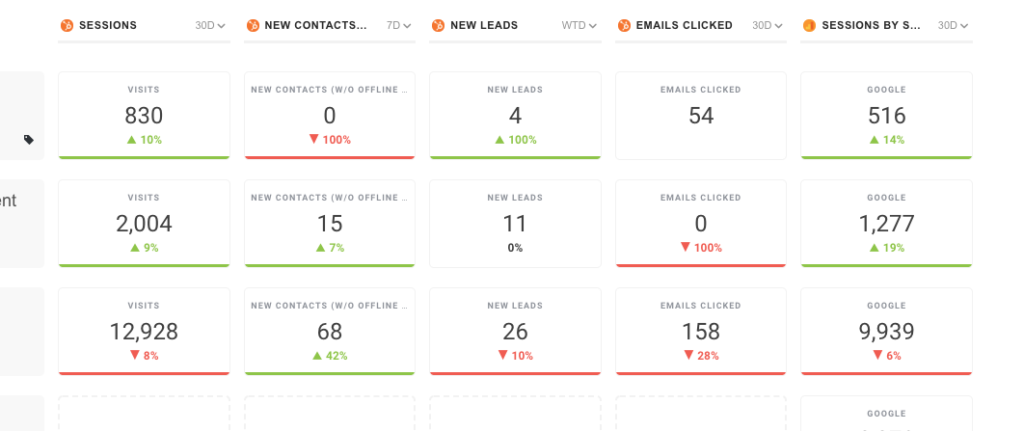
Databox keeps “your KPIs front and center” by pulling data and analytics from different sources like Google Analytics, Hubspot, and Facebook. From there, you can create Databoards that track different goals.
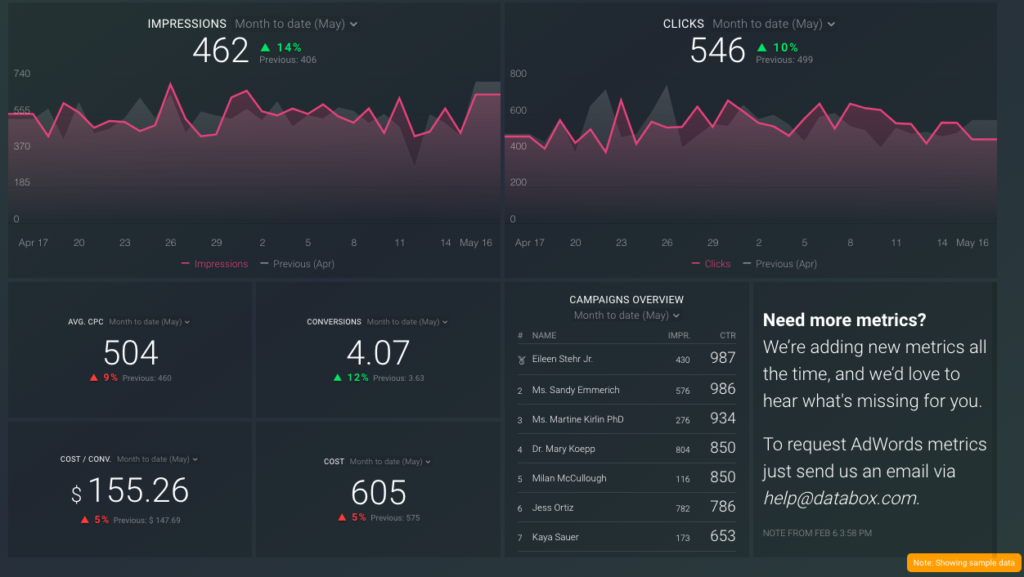
Track Google AdWords
Track Facebook Ad Campaigns
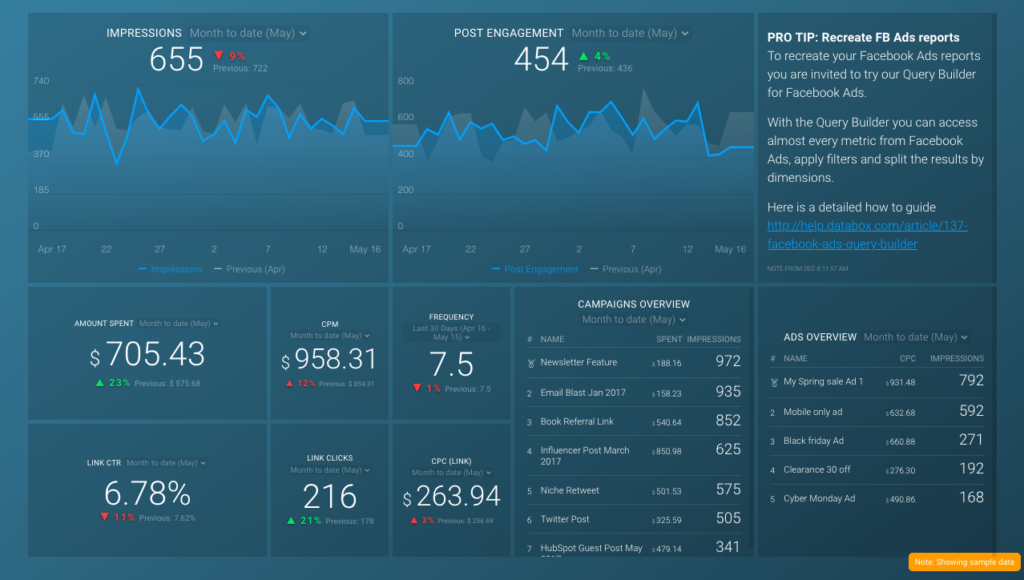
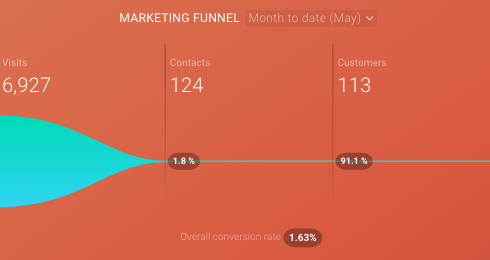
Databoards are simple to manage and can easily be shared with my team as well as clients. Everyone is able to log-in to Databox and see how sales, marketing, and the overall business performed on a daily basis. From there, we can manipulate our strategy to make sure we crush our monthly, quarterly, and annual goals.
Crushing Goals
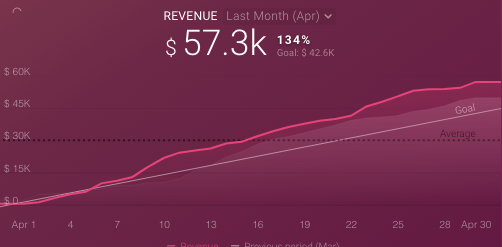
We are constantly finding new ways to improve with Databox and last month we crushed it! Our clients have lofty goals heading into the summer and one client in particular set a goal to increase online sales in April by 180% from last year.
Spoiler! We hit our goal by 134%! Almost double the sales from last year.
But how?!
We are lucky to have a Google Adwords whizz on our team and for this particular client, we wanted to attract more people to the site with ads from Google. We created a Databoard that tracked our Google Ads and keywords and kept an eye on it daily. We’d see which ads and keywords were performing the best and the worst. We’d remove ads that were getting zero clicks and put more money toward ads performing well.
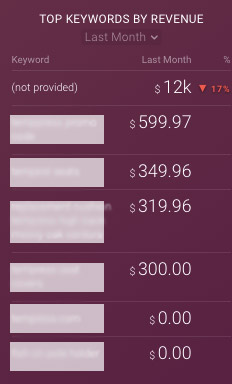
Not only were we tracking ads and keywords but the performance of landing pages, emails, and overall conversion rates.
This plethora of data helped us easily stay in control of our Google Adwords campaign and maximize our client’s ROI. Needless to say, when we called our client for their monthly review they were ecstatic.
Give Me More Data!
We like tooting our own horn with all the positive data Databox provides but it isn’t always sunshine and rainbows. Sometimes when we log-in we notice traffic to the website is down, conversion rate is dropping, or blog views are low.
And instead of running to my closet to cry for 20 minutes like my youngest daughter likes to do, we dig through the data a little more to find out why. Why are views, traffic, and clicks down? The “Goals” section allows us to quickly check in on our client goals and adjust our efforts accordingly.
Are You Convinced?
If you are a data junkie like we are then Databox is your new BFF! If you want more information on Databox, head on over to their site or contact us below to schedule a free consultation.
